How to Analyze Your Vinyl Listening Habits with Data Visualization
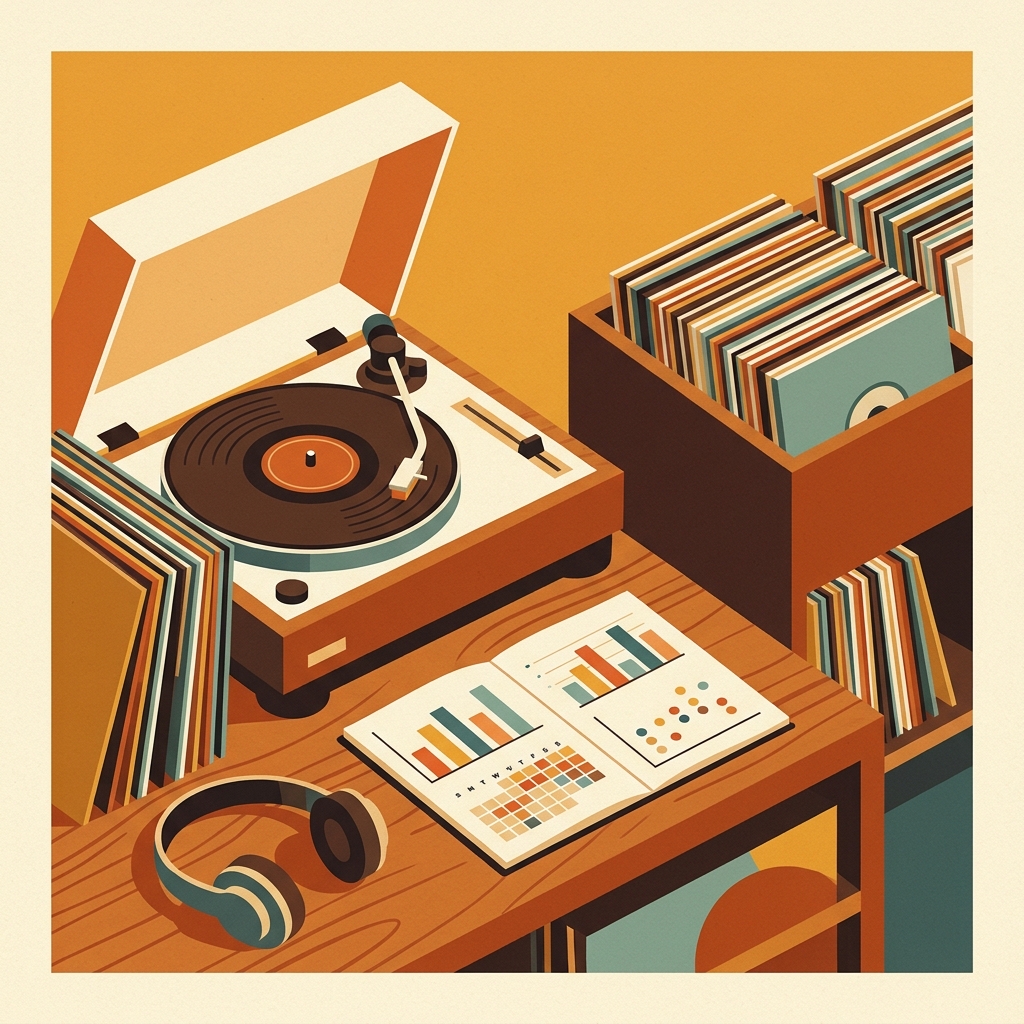
Most vinyl collectors know what they own, but fewer know what they actually play. That difference is where a listening log becomes interesting. A shelf can say, “I collect jazz, post-punk, and soul.” Your listening data might say, “I play 12 familiar records on Friday nights and ignore half the jazz section.” Neither answer is wrong, but the second one describes your real listening life.
This guide explains how to turn a simple record-play history into clear, useful charts. You do not need to become a data scientist. You need consistent entries, a few well-chosen metrics, and visualizations that answer questions you genuinely care about.
Why vinyl listening data is worth tracking
Vinyl is an active format. You choose a record, handle it, play a side, and decide whether to flip it. That creates richer behavioral signals than a passive stream. It also matters in a market where records remain a major physical format. The RIAA reported that vinyl represented nearly three quarters of physical music revenue in the first half of 2025, with 23.6 million units shipped. Collectors are buying plenty of records, so understanding whether those purchases enter the listening rotation is increasingly useful. RIAA, 2025 Mid-Year Revenue Report
Listening histories can reveal patterns that memory misses. Research into personal music histories shows that old listening records can also trigger memories and reflection. University of Washington
Start with a clean listening log
At minimum, record the date, artist, album, and time. For vinyl, add fields that streaming logs usually lack:
- Pressing or edition, if you own multiple copies
- Side A, Side B, or complete album
- New purchase, familiar favorite, or rediscovery
- Listening context, such as focused, background, guests, or testing gear
- Optional rating or short note
Consistency beats detail. A sparse six-month log is more useful than a perfect spreadsheet abandoned after a week. If you use What’s Spinning for now-playing sessions, copy those entries into a spreadsheet for analysis.
Digital services offer useful precedents. Last.fm calls a recorded play a “scrobble” and builds history from timestamped events. Last.fm Scrobbling API Discogs exposes collection folders and releases through its API, helping technical collectors compare owned records with played records. Discogs API documentation
Choose questions before charts
Do not begin with “What chart can I make?” Begin with “What do I want to learn?” Good starter questions include:
- Which records receive the most plays?
- How much of my collection have I played this year?
- Which purchases never entered regular rotation?
- Do I favor certain genres, decades, or artists?
- When do I listen, and how often do I finish both sides?
A focused question prevents dashboard clutter. Research on personal music analytics supports viewing the same history through time, artist, track, and category perspectives. “Characterizing and Visualizing Personal Music Listening Histories,” 2023
Five visualizations that work especially well
1. Ranked bar chart for your true rotation
Count plays by album and sort from highest to lowest. A horizontal bar chart makes long album titles readable. Add a cumulative percentage column to see concentration. If your top 10 records account for 40 percent of all sessions, your collection may be broad while your rotation is narrow.
2. Calendar heatmap for listening rhythm
Give each day a color based on the number of records played. This reveals streaks, quiet periods, weekend habits, and seasonal changes. It can also expose logging gaps. A blank month might mean no listening, or it might mean the habit of recording sessions broke down.
3. Scatter plot for ownership versus attention
Put purchase date on one axis and play count on the other. New records with many plays are immediate hits. Older records with few plays form a neglected-shelf group. Add price as point size only if you want to test whether expensive purchases receive more attention.
4. Stacked bars for side completion
For each album, compare Side A only, Side B only, and complete plays. A high Side A share may reflect time constraints, front-loaded sequencing, or a weak second side. This turns a vague impression into something testable.
5. Monthly genre or decade trends
Use a stacked area chart or small multiples to show how taste changes over time. Perhaps soul dominates winter or dance records rise in summer. Combine tiny groups into “Other” rather than creating an unreadable rainbow.
Calculate metrics that lead to action
Charts become more useful when paired with a few simple measures:
- Collection coverage: unique records played divided by records owned
- Rotation concentration: percentage of all plays represented by your top 10 albums
- Repeat interval: median days between plays of the same album
- Unplayed acquisition rate: purchases still unplayed after 30 or 90 days
- Rediscovery count: records played after at least one year of inactivity
Imagine a 600-record collection with 180 unique albums played during the year. Coverage is 30 percent. If 72 of 360 sessions came from the top 10 albums, rotation concentration is 20 percent. These are prompts, not grades. Try a weekly “unplayed shelf” session, or accept that a concentrated rotation suits you.
A practical monthly workflow
- Export or copy your listening log into Google Sheets, Excel, or a CSV file.
- Standardize artist and album names so spelling variations do not split totals.
- Create a pivot table counting sessions by album, artist, genre, and month.
- Build two charts: one ranking chart and one time-based chart.
- Write down one observation and one experiment for the next month.
For example: “I bought eight records but played only three. Next month, every arrival gets a full play within seven days.” That is more useful than a dashboard that never changes behavior.
Avoid the common data traps
Do not confuse play count with affection. A background record may accumulate plays faster than a demanding favorite. Do not compare incomplete months or let inconsistent genre labels create fake variety. The visualization should support curiosity, not guilt.
FAQ
What is the easiest way to track vinyl listening habits?
Log the date, artist, album, and whether you played one side or the full record. A simple spreadsheet or a dedicated now-playing app is enough. Add more fields only after the basic habit feels automatic.
How much data do I need before making charts?
You can make a useful weekly chart after 10 to 20 sessions, but one to three months gives a more representative view. Seasonal conclusions usually require at least a year of consistent data.
Which chart is best for finding neglected records?
A scatter plot of purchase date versus play count works well. You can also filter your collection for records with zero plays, then sort by purchase date or value to create a practical listening queue.
Should individual sides count as separate plays?
Track sides separately if side completion matters to you. Otherwise, count one listening session per album and add a completion field. The important rule is to use the same method consistently.
Final thought
The best vinyl listening visualization is the one that makes you pull a forgotten record from the shelf or understand why certain albums keep returning to the platter. Start with one month of data, answer one question, and let the charts grow with the collection.
A spreadsheet tracks what you own. What's Spinning identifies what's playing.
On-device vinyl ID logs your listening history automatically. 7-day free trial.
Looking for Shazam for vinyl?
What's Spinning identifies what's playing on your turntable on-device, logs history, and AirPlays now-playing to your TV.
Comparing vinyl ID apps?
Analog requires Discogs and is iPhone-first (iPad coming). What's Spinning works without Discogs on iPhone and iPad with AirPlay.
Try What's Spinning Free
Turn your iPad into a live now-playing display. Track every record you spin.
START FREE TRIALThen $4.99/mo or $39.99/yr · Cancel anytime
Get it on your iPhone
Open on iPhone